

Canada’s Public Schools: Are we paying more but getting less?
The question of value for money is central to any public policy consideration. Given its scale, coupled with its critical social and economic impact, education ranks as one of the most important and challenging policies for analysis.
By Jim Marshall, Executive-in-Residence, Johnson Shoyama Graduate School of Public Policy (JSGS); Haizhen Mou, Associate Professor, JSGS; Michael Atkinson, Professor Emeritus, JSGSMotivation—Why study efficiency?
The question of value for money is central to any public policy consideration. Given its scale, coupled with its critical social and economic impact, education ranks as one of the most important and challenging policies for analysis. Education operating spending by school boards across Canada amounted to $53.2 billion in 20152and that amount has been growing at the rate of more than $1 billion per year for some time.
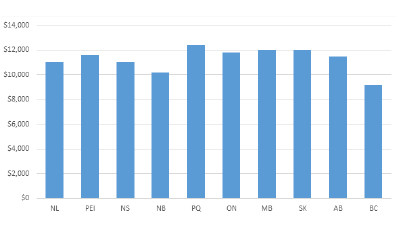
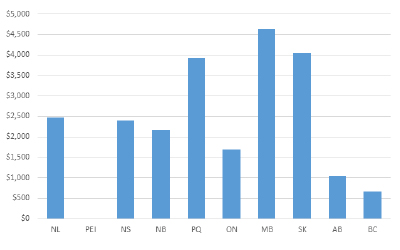
In Canada, spending per student averaged $11,274 in 2015. But an examination of Figure 1 shows that spending on a per student basis varies quite substantially among the provinces with Quebec spending the most at $12,407 per student and BC spending the least at $9,180 per student. The range invariably raises the issue of who is getting the best return on the public investment, and why.
Figure 1: Total school board operating expenditures in 2015, per student ($)
Much has been said about the results of such spending, with some questioning whether public school expenditures are producing satisfactory results in student achievement. According to results from the Program for International Student Assessment (PISA), Canadian students have had uneven and even declining achievements.
Designed by the Organization for Economic Co-operation and Development (OECD), PISA conducts standardized tests among students in participating jurisdictions and measures student capacity in three domains: reading, mathematics and science. Tests are conducted at three-year intervals to provide tracking of changes in student performance on the tests over time. An examination of the average student performance on the PISA tests in 2015, by province, is provided in Figure 2.
Figure 2: Average PISA Scores of Students in Public Schools by Province in 2015
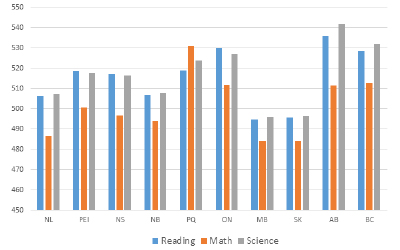
As Figure 2 shows, there is considerable variation in the results on PISA tests among the provinces, with Alberta students performing at the highest level in reading and science and Quebec students achieving the highest scores in mathematics. At the other extreme, Saskatchewan students did poorly in mathematics and Manitoba students scored the lowest in reading and science.
A quick comparison of Figures 1 and 2 indicates that there is a significant disconnect between the amount spent on education and the results achieved in standardized PISA tests. The highest spending provinces, Quebec, Saskatchewan and Manitoba are not necessarily achieving the best results and the lowest spending provinces, British Columbia and New Brunswick, are not necessarily achieving the worst PISA results.
As we discovered, few have analyzed the efficiency of the public education sector in Canada in terms of its ability to use resources to generate measurable outcomes. In other words, is government maximizing value for its investment in public education? So, in 2015, the Johnson Shoyama Graduate School of Public Policy began a major research project on the efficiency of public spending in Canada, focused on provincial government spending in the field of public education at the Kindergarten to Grade 12 (K-12) level.
What we did
First, we found Statistics Canada data on government spending on the K-12 system in the 10 provinces in Canada (as shown in Figure 1 for 2016).
Next, we examined historical trends in measured student performance in the 10 provinces on standardized PISA tests in reading, math and science from six tests taken in 2000, 2003, 2006, 2009, 2012, and 2015.
Using these time-series, we attempted to determine the rates at which various provinces turn inputs (resources) into outputs (student numbers and measured student performance) in each jurisdiction. In other words, we examined the efficiency of each province’s education system in terms of its ability to produce PISA results for the money it spends.
What we found—Time series
From 2000 to 2015 per student expenditures (adjusted for inflation) grew by 41 per cent in the 10 provinces.
During the same time period, enrollments fell by 7 per cent across the provinces.
But, student performance on PISA tests also fell over this period by:
- 11 points in reading (about 2 per cent)
- 23 points in math (about 4.5 per cent), and
- 4 points in science (about 1 per cent).
So while public spending increased significantly, outcomes, as measured by PISA test results, declined.
Figure 3: Efficiency Rating, all provinces (2000=100%)
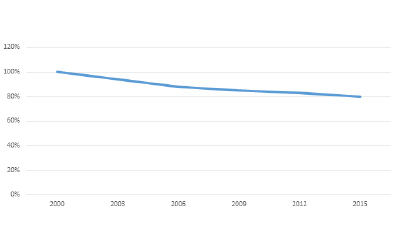
In Figure 3, we show our calculations of education efficiency in terms of the rate at which the spending is generating PISA results, once we adjust spending for inflation and for enrollment changes. In this figure, the scale starts with the base year, 2000, equal to 100 per cent.
What the calculation shows is that education spending since 2000 has become less efficient in turning greater resources into improved student performance in Canada.
What we found—Comparing provinces
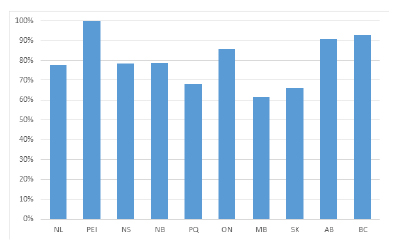
In 2015, the most cost-efficient provinces were Prince Edward Island, British Columbia, and Alberta. The least efficient were Quebec, Saskatchewan and Manitoba.
Figure 4: Cost efficiency scores in 2015
Using these measures, it is possible to estimate the savings per student that would occur in each province, if it were able to match the apparent success of Prince Edward Island in turning education dollars into PISA results. This calculation is shown in Figure 5.
Figure 5: Potential cost saving in 2015, per student ($)1
If Manitoba (the least efficient) were to match Prince Edward Island (the most efficient) in terms of using its spending to generate the student scores it obtained in 2015, it would have saved $4,629 per student in 2015. For Manitoba this would amount to a potential efficiency gain of $838 million in 2015 on the province’s education budget (based on 180,000 students).
By aggregating the PEI efficiency outcomes nationally, or in other words applying the PEI standard to all other provinces, overall savings in Canada could have amounted to $7.5 billion in 2015, or almost 13 per cent of the total spent on K-12 education.
Of course, one option might involve redeploying these potential savings within the education sector to generate even better student outcomes. This is a choice that remains to be examined. The first step towards generating better student outcomes is in recognizing that some of our public school systems seem to be much better at generating results than others. A deeper examination of these best practices, applied generally, could result in a more effective public school system for all.
Budget processes
As part of this study, we also examined the way in which each of the provinces constructed their budgets, to see if there was a pattern to the consideration of outcomes or outputs in their budget processes.
We interviewed 28 budget officers from 12 provinces and territories, including 12 people who worked for central budget authorities and 16 people who worked for education departments delivering K-12 programming.
We were surprised to learn that data on school performance was routinely collected and analysed in only four of the 12 jurisdictions that we examined. Even more surprising, we discovered that only one of these four jurisdictions routinely considered performance data in the budget process.
In other words, education authorities do not appear to be making funding decisions based on any data about student achievement. It is not a great surprise, then, that in many cases, it appears that they are not maximizing the results they are achieving for the dollars they spend.
There may be many reasons why some public school systems seem to be better at generating student results than some others but, at least among the provinces, one of the reasons may be simply that no one is asking the system to use its funding as efficiently or as effectively as they can.
Other factors
Some have suggested that PISA scores should not be taken as sole indicators of student achievement or public school system success.
Others might suggest that studies of this sort need to consider other factors that might explain differences in results among provinces such as differences in socio-economic conditions and differences in student demography or geographic dispersion. Some have suggested that education outputs and outcomes can be affected by the quality of inputs and the specific educational techniques employed in specific circumstances. We have not considered such factors that might help us to understand differences in results or differences in ways to measure results or to understand the relationships between inputs and outcomes.
It might well be that a more in depth examination could help to better understand the current disparities in student outcomes. We have found, however, that funding differences are not the explanation—more money does not mean better results and less money does not mean worse results.
Perhaps it is time we asked the Council of Ministers of Education to examine whether adopting the best practices of successful provinces can improve the value for money achieved in other provinces and what, exactly, those best practices are.
Footnotes
1 These charts are based on the study: Haizhen Mou, Michael M. Atkinson & Jim Marshall (2019) Budgeting for efficiency? A case
study of the public K-12 education systems of Canada, Applied Economics. DOI: 10.1080/00036846.2019.1584380.
2 Statistics Canada Table 37-10-0065-01 accessed February 25, 2019.
ISSN 2369-0224 (Print) ISSN 2369-0232 (Online)
Jim Marshall

Jim Marshall is currently a Lecturer and Executive-in-Residence at the Johnson Shoyama Graduate School of Public Policy’s University of Regina campus. Prior to this, Mr. Marshall served in the Public Service of Saskatchewan for 34 years, occupying senior policy and executive positions in the Department of Finance and Industry and Resources and at the Crown Investments Corporation. Before moving to Saskatchewan, Mr. Marshall lectured in economics at Brandon University and conducted research at the Library of Parliament in Ottawa. Mr. Marshall has lectured in economics and public policy at JSGS, the University of Regina, Faculty of Administration and the University of Regina, Department of Economics. He is a graduate of Brandon University and the University of Calgary.
Haizhen Mou

Haizhen Mou is an Associate Professor and Graduate Chair at the Johnson Shoyama Graduate School of Public Policy’s University of Saskatchewan campus. Her primary research interests include fiscal governance, government budget management, fiscal federalism, and health care financing and expenditure, often from a political economy perspective. She is the principal investigator on a a SSHRC Insight Development Grant and is a co-applicant on a CIHR award, among several other awards. Her main teaching responsibilities include Public Finance and Quantitative Research Method for graduate students. She has supervised nine Ph.D. or MPP students and served on numerous graduate thesis committees.
Michael Atkinson

Michael Atkinson is a Professor Emeritus in the Johnson Shoyama Graduate School of Public Policy’s University of Saskatchewan campus. He has held a number of academic administrative appointments including Associate Vice President Academic at McMaster University (1995-97) and Provost and Vice President Academic at the University of Saskatchewan (1997-2007). He served as the founding Executive Director of Johnson Shoyama (2008-2015) and has also held visiting appointments at Duke University, Western University and the Université de Strasbourg. He is a past-President of the Canadian Political Science Association and in 2012 was awarded the Lieutenant Governor’s gold medal for achievement in public administration. His research interests include public sector compensation, political ethics and the broad topic of good governance.
People who are passionate about public policy know that the Province of Saskatchewan has pioneered some of Canada’s major policy innovations. The two distinguished public servants after whom the school is named, Albert W. Johnson and Thomas K. Shoyama, used their practical and theoretical knowledge to challenge existing policies and practices, as well as to explore new policies and organizational forms. Earning the label, “the Greatest Generation,” they and their colleagues became part of a group of modernizers who saw government as a positive catalyst of change in post-war Canada. They created a legacy of achievement in public administration and professionalism in public service that remains a continuing inspiration for public servants in Saskatchewan and across the country. The Johnson-Shoyama Graduate School of Public Policy is proud to carry on the tradition by educating students interested in and devoted to advancing public value.